BCC Tumor Microenvironment
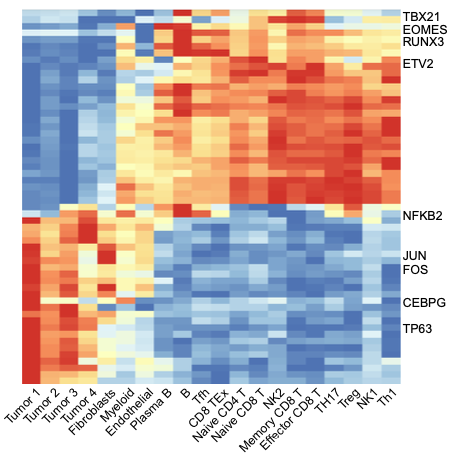
We applied SCRIP to a Basal Cell Carcinoma (BCC) tumor microenvironment (TME) dataset (Satpathy et al., Nat Biotechnol, 2019) to investigate how TRs and their target genes were changed in different cell states under disease status. Data was downloaded from GEO with accession GSE129785.
SCRIP enrich -i example/TME/data/BCC_peak_count.h5 -s hs -p example/TME/BCC_SCRIP -t 32
SCRIP enrich -i example/TME/data/Tcell_peak_count.h5 -s hs -p example/TME/Tcell_SCRIP -t 32
library(Seurat)
library(plyr)
library(patchwork)
library(dplyr)
library(pheatmap)
library(stringr)

se <- readRDS("example/TME/data/scATAC_TME_All_SummarizedExperiment.final.rds")
all_tumor_table <- read.table("example/TME/BCC_SCRIP/enrichment/SCRIP_enrichment.txt")
all_tumor_table_norm <- all_tumor_table

cluster <- mapvalues(rownames(all_tumor_table_norm),se@colData@listData[["Group_Barcode"]],se@colData@listData[["Clusters"]])
rownames(all_tumor_table_norm) <- paste(cluster,1:length(rownames(all_tumor_table_norm)),sep = "_")
all_tumor_table_norm <- apply(all_tumor_table_norm, 2, function (x) (x-min(x))/(max(x)-min(x)))

all_tumor_seurat <- CreateSeuratObject(counts = t(all_tumor_table_norm),project = "tumor")
all_tumor_seurat <- NormalizeData(all_tumor_seurat)
all.genes <- rownames(all_tumor_seurat)
all_tumor_seurat <- ScaleData(all_tumor_seurat, features = all.genes)

cluster_all <- c("Cluster17","Cluster18","Cluster19","Cluster20")
cluster_normal <- paste("Cluster",c(1:16),sep = "")
bcc_tf <- vector("list",length(cluster_all))
for (i in seq_along(cluster_all)) {
    cluster_markers <- FindMarkers(all_tumor_seurat,
                                    ident.1 = cluster_all[i],
                                    ident.2 = cluster_normal,
                                    logfc.threshold = 1)
    bcc_tf[[i]] <- rownames(cluster_markers)
}


cell_cluster <- paste("Cluster",1:20,sep = "")
cell_cluster_type <- c("Naive CD4 T","TH17","Tfh","Treg","Naive CD8 T","Th1","Memory CD8 T","CD8 TEx","Effector CD8 T",
                        "NK1","NK2","B","Plasma B","Myeloid","Endothelial","Fibroblasts","Tumor 1","Tumor 2","Tumor 3","Tumor 4")
bcc_tf <- bcc_tf[bcc_tf %in% colnames(all_tumor_table)]
tumor_type <-  as.data.frame(cbind(cluster = se@colData@listData[["Clusters"]],barcode = se@colData@listData[["Group_Barcode"]]))
tumor_cell_f <- all_tumor_table[,bcc_tf]
tumor_cell_f$barcode <- rownames(tumor_cell_f)
tem <- inner_join(tumor_cell_f,tumor_type,by = "barcode")
TF_mean <- as.data.frame(group_by(tem,cluster) %>% summarise_each(funs = mean))
rownames(TF_mean) <- mapvalues(TF_mean$cluster,cell_cluster,cell_cluster_type)
TF_mean <- TF_mean[,-c(1,length(TF_mean))]

TF_mean <- apply(TF_mean, 2, function (x) (x-min(x))/(max(x)-min(x)))
all_tumor <- pheatmap(t(TF_mean), border_color= NA, fontsize_row = 13, fontsize_col = 17, treeheight_col = 0, treeheight_row = 0)
library(Matrix)
library(SummarizedExperiment)
library(matrixStats)
library(magrittr)
library(edgeR)
library(TTR)
set.seed(1)
tcell_table_tra <- read.table("example/TME/Tcell_SCRIP/enrichment/SCRIP_enrichment.txt")
trajectory <- paste0("Cluster",c(13,15,16,17))
df <- data.frame(row.names = colnames(se), x = colData(se)$UMAP1, y = colData(se)$UMAP2, Group = colData(se)$T_Cell_Cluster)
trajAligned <- alignTrajectory(df, trajectory)
df2 <- trajAligned[[1]]
map <- mapvalues(x = rownames(tcell_table_tra), from = se@colData@listData[["Group_Barcode"]], to = se@colData@listData[["Internal_Name"]])
rownames(tcell_table_tra) <- map
df2 <- df2[order(df2$pseudotime), ]
pseudotime_index <- rownames(df2)
test_omit_table <- tcell_table_tra[pseudotime_index,]
test_omit_table <- na.omit(test_omit_table)
psudotime_table <- df2[rownames(test_omit_table),]
# rename enrichment_table rownames to their cluster and normalization,construct Seurat object
cluster <- mapvalues(rownames(tcell_table_norm),se@colData@listData[["Group_Barcode"]],se@colData@listData[["T_Cell_Cluster"]])
rownames(tcell_table_norm) <- paste(cluster,1:length(rownames(tcell_table_norm)),sep = "_")
tcell_table_norm <- apply(tcell_table_norm, 2, function (x) (x-min(x))/(max(x)-min(x)))
cluster_tcell_seurat <- CreateSeuratObject(counts = t(tcell_table_norm))
cluster_tcell_seurat <- NormalizeData(cluster_tcell_seurat)
all.genes <- rownames(cluster_tcell_seurat)
cluster_tcell_seurat <- ScaleData(cluster_tcell_seurat, features = all.genes)
# calculate specific TF of naivet,earlyTEx,interTEx,TEx
cluster_markers_naivet <- FindMarkers(cluster_tcell_seurat,
ident.1 = "Cluster13",
ident.2 = c("Cluster15","Cluster16","Cluster17"),
only.pos = TRUE,
logfc.threshold = 0.1)
cluster_markers_naivet <- cluster_markers_naivet[order(cluster_markers_naivet$avg_log2FC,decreasing = T), ][c(1:25),]
cluster_markers_earlyTEx <- FindMarkers(cluster_tcell_seurat,
ident.1 = "Cluster15",
ident.2 = c("Cluster13","Cluster16","Cluster17"),
only.pos = TRUE,
logfc.threshold = 0.1)
cluster_markers_earlyTEx <- cluster_markers_earlyTEx[order(cluster_markers_earlyTEx$avg_log2FC,decreasing = T), ][c(1:25),]
cluster_markers_interTEx <- FindMarkers(cluster_tcell_seurat,
ident.1 = "Cluster16",
ident.2 = c("Cluster13","Cluster15","Cluster17"),
only.pos = TRUE,
logfc.threshold = 0.1)
cluster_markers_interTEx <- cluster_markers_interTEx[order(cluster_markers_interTEx$avg_log2FC,decreasing = T), ][c(1:25),]
cluster_markers_TEx <- FindMarkers(cluster_tcell_seurat,
ident.1 = "Cluster17",
ident.2 = c("Cluster13","Cluster15","Cluster16"),
only.pos = TRUE,
logfc.threshold = 0.1)
cluster_markers_TEx <- cluster_markers_TEx[order(cluster_markers_TEx$avg_log2FC,decreasing = T), ][c(1:25),]
tcell_tf <- unique(c(rownames(cluster_markers_naivet),rownames(cluster_markers_earlyTEx),rownames(cluster_markers_interTEx),rownames(cluster_markers_TEx)))
plot_table <- tcell_table_tra[rownames(psudotime_table),c(tcell_tf)]
plot_table <- na.omit(plot_table)
for (i in seq_along(plot_table)) {
t <- ts(plot_table[,i])
plot_table[,i] <- SMA(t,n=8)
}
plot_table <- plot_table[-c(1:7),]
plot_table <- apply(plot_table, 2, function (x) (x-min(x))/(max(x)-min(x)))
tcell_cluster <- c("Cluster13","Cluster15","Cluster16","Cluster17")
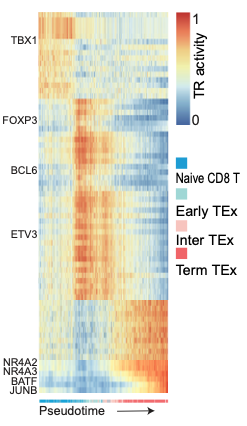
tcell_cluster_type <- c("Naive CD8 T","Early TEx","Intermediate TEx","Terminal TEx")
psudotime_table$Group <- mapvalues(psudotime_table$Group,tcell_cluster,tcell_cluster_type)
plot_anno <- select(psudotime_table,Group)
plot_anno <- slice(plot_anno,8:length(rownames(plot_anno)))
ann_colors = list(
CellType = c("Naive CD8 T" = "#00AEEC", "Early TEx" = "#b2f7ef","Intermediate TEx" = "#fcd5ce","Terminal TEx" ="#FF6D6F")
)
t <- pheatmap(t(plot_table),border=FALSE,annotation_colors = ann_colors,annotation_col = plot_anno,legend_breaks = c(1,0),fontsize_row = 20,cellheight = 17,cellwidth = 0.055,cluster_rows = FALSE,cluster_cols = FALSE,fontsize_col = 10,show_colnames = F,treeheight_row = 0)
SCRIP impute -i example/TME/data/Tcell_peak_count.h5 -s hs -p example/TME/Tcell_SCRIP/ -f h5ad --factor JUNB
SCRIP target -i example/TME/Tcell_SCRIP/imputation/imputed_JUNB.h5ad -s hs -o JUNB_target.h5ad
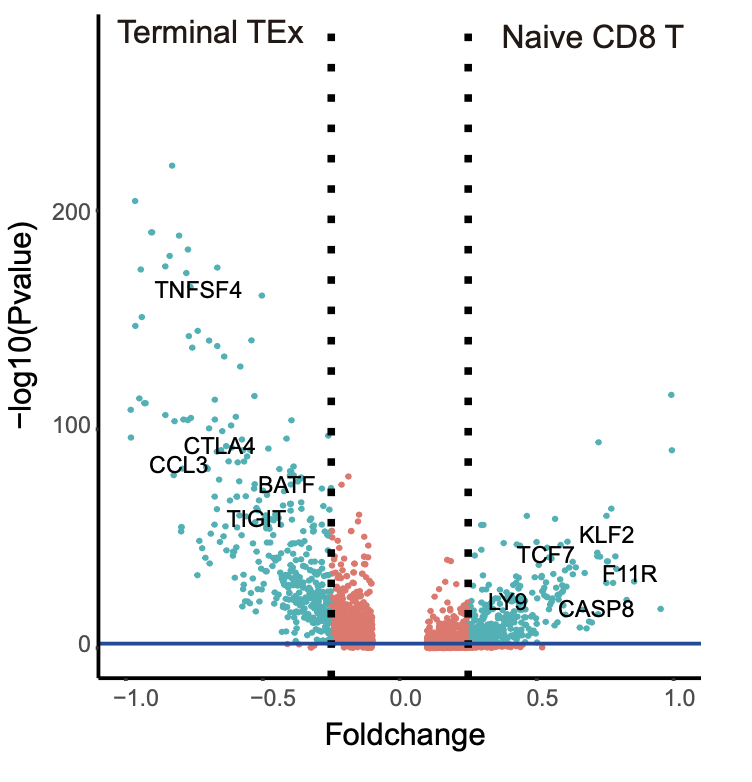
cluster_markers_all <- FindMarkers(naive_tex_seurat,
                                 ident.1 = "Cluster13",
                                 ident.2 = "Cluster17",
                                 logfc.threshold = 0.1)
volcano <- cluster_markers_all[,c(1,2)]
colnames(volcano) <- c("Pvalue","Foldchange")
threshold<-as.factor((volcano$Foldchange>0.25|volcano$Foldchange<(-0.25))&volcano$Pvalue<0.01)
r = ggplot(volcano,aes(Foldchange,-log10(Pvalue),colour=threshold)) +
    geom_point() +
    labs(title="Volcanoplot") +
    theme(plot.title = element_text(hjust = 0.25)) +
    xlim(-1,1) +
    theme_classic() +
    geom_vline(xintercept=c(-0.25,0.25),linetype="dotted",size=1) +
    geom_hline(yintercept=-log10(0.01),col="blue")
r
library(plyr)
library(ggplot2)
library(Seurat)
library(clusterProfiler)
library(org.Hs.eg.db)
library(dplyr)

tex_use<-Read10X("example/TME/Tcell_SCRIP/imputation/JUNB_10x",gene.column =1)
tex_USE<-t(tex_use)

tex_ENTREZID<-c()
GO <- g_n
for (i in GO){
t<-unique((as.character(unlist(strsplit(GO[i,8],split="/")))))
tex_ENTREZID<-append(tex_ENTREZID,t)
tex_ENTREZID<-unique(tex_ENTREZID)
}
tex_trans <- bitr(tex_ENTREZID, fromType="ENTREZID", toType=c("SYMBOL"), OrgDb="org.Hs.eg.db")

eg_naive <- bitr(naive_target,
             fromType="SYMBOL",
             toType=c("ENTREZID","ENSEMBL",'SYMBOL'),
             OrgDb="org.Hs.eg.db")
go_naive <- enrichGO(eg_naive$ENTREZID,
                    OrgDb = org.Hs.eg.db,
                    ont='BP',
                    pAdjustMethod = 'BH',
                    pvalueCutoff = 0.1,
                    keyType = 'ENTREZID')
go_naive <- go_naive[order(go_naive[,9],decreasing = TRUE),]

eg_tex <- bitr(tex_target,
           fromType="SYMBOL",
           toType=c("ENTREZID","ENSEMBL",'SYMBOL'),
           OrgDb="org.Hs.eg.db")
# Run GO enrichment analysis
go_tex <- enrichGO(eg_tex$ENTREZID,
                OrgDb = org.Hs.eg.db,
                ont='BP',
                pAdjustMethod = 'BH',
                pvalueCutoff = 0.1,
                keyType = 'ENTREZID')
go_tex <- go_tex[order(go_tex[,9],decreasing = TRUE),]
go_tex <- go_tex[grep("negative",go_tex$Description),][c(1:6),]
