Peripheral Blood Mononuclear Cells (PBMC)
The PBMC multiome data was downloaded on the 10X genomics website. We downloaded the h5 file of scRNA-seq and scATAC-seq and processed with following codes.
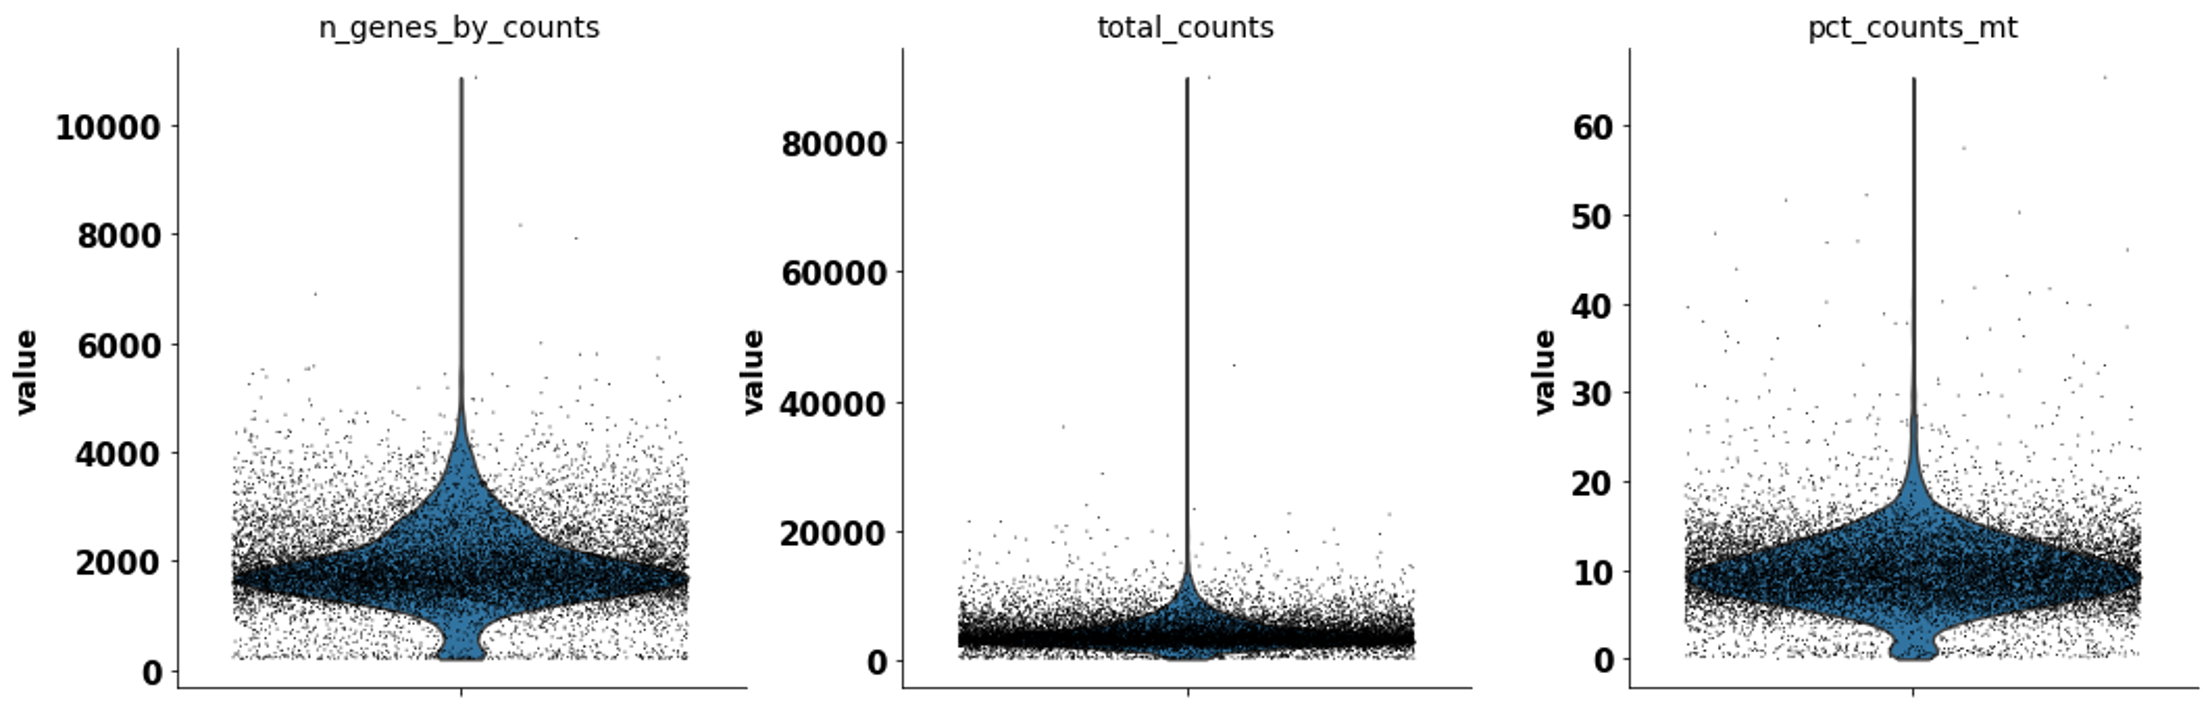
Since there is no annotation in scRNA-seq data, we first annatate the scRNA-seq dataset. First, We used the scanpy to perform the basic QC for scRNA-seq.
import os
import sys

import numpy as np
import pandas as pd
import anndata as ad

import seaborn as sns
import scanpy as sc

from SCRIP.utilities.utils import print_log, safe_makedirs, read_SingleCellExperiment_rds, excute_info, read_pickle, write_to_mtx

rna_adata = sc.read_10x_h5('example/PBMC/data/pbmc_granulocyte_sorted_10k_raw_feature_bc_matrix.h5')
rna_adata.var_names_make_unique()
sc.pp.filter_cells(rna_adata, min_genes=200)
sc.pp.filter_genes(rna_adata, min_cells=3)
rna_adata.var['mt'] = rna_adata.var_names.str.startswith('MT-')  # annotate the group of mitochondrial genes as 'mt'
sc.pp.calculate_qc_metrics(rna_adata, qc_vars=['mt'], percent_top=None, log1p=False, inplace=True)
sc.pl.violin(rna_adata, ['n_genes_by_counts', 'total_counts', 'pct_counts_mt'], jitter=0.4, multi_panel=True)
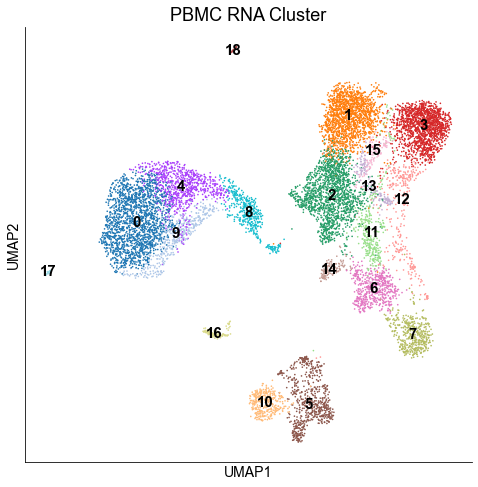
We clustered the cells with the louvain algorithm.
rna_adata = rna_adata[rna_adata.obs.n_genes_by_counts < 6000, :]
rna_adata = rna_adata[rna_adata.obs.pct_counts_mt < 20, :]
rna_adata = rna_adata[keep_cell_index,:]
sc.pp.normalize_total(rna_adata, target_sum=1e4)
sc.pp.log1p(rna_adata)
sc.pp.highly_variable_genes(rna_adata, min_mean=0.0125, max_mean=3, min_disp=0.5)
rna_adata.raw = rna_adata
sc.pp.regress_out(rna_adata, ['total_counts'])
sc.pp.scale(rna_adata, max_value=10)
sc.tl.pca(rna_adata, svd_solver='arpack')
sc.pp.neighbors(rna_adata, n_neighbors=10, n_pcs=40)
sc.tl.umap(rna_adata)
sc.tl.louvain(rna_adata)
sc.tl.rank_genes_groups(rna_adata, 'louvain', method='wilcoxon')
fig, ax = plt.subplots(1,1,figsize=(8,8))
sc.pl.umap(rna_adata, color=['louvain'], legend_loc='on data', title='PBMC RNA Cluster', legend_fontsize=15, ax=ax)
fig.show()
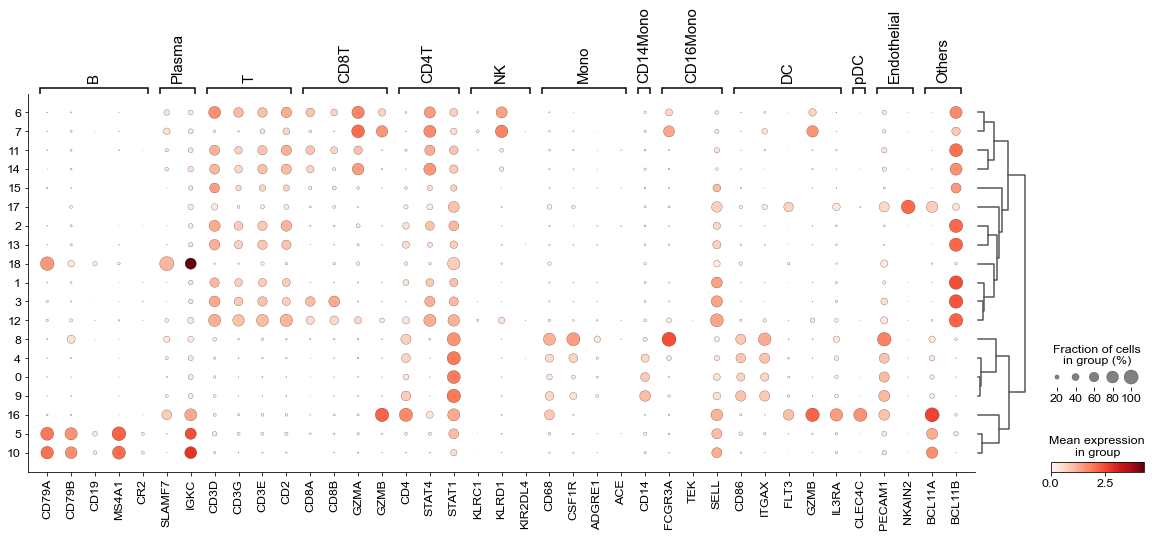
We annotated the cells with well-known gene markers.
marker_dict = {  'B': ['CD79A', 'CD79B', 'CD19', 'MS4A1', 'CR2'],
                'Plasma': ['SLAMF7', 'IGKC'],
                'T': ['CD3D', 'CD3G', 'CD3E', 'CD2'], # T
                'CD8T': ['CD8A', 'CD8B','GZMA','GZMB'], # cd8
                'CD4T': ['CD4', 'STAT4', 'STAT1'], # cd4
                'NK': ['KLRC1', 'KLRD1'], #NK
                'Mono': ['CD68', 'CSF1R', 'ADGRE1'],
                'CD14Mono': ['CD14'], #mono
                'CD16Mono': ['FCGR3A', 'TEK', 'SELL'], #mono
                'DC': ['CD86', 'ITGAX', 'FLT3', 'GZMB', 'IL3RA'], #dc
                'pDC': ['CLEC4C'], # pdc
                'Endothelial': ['PECAM1', 'NKAIN2'],  # endothelial
                'Others':['BCL11A', 'BCL11B']
                }


fig, ax = plt.subplots(1,1,figsize=(20,8))
sc.pl.dotplot(rna_adata,marker_dict, 'louvain', dendrogram=True, ax=ax)
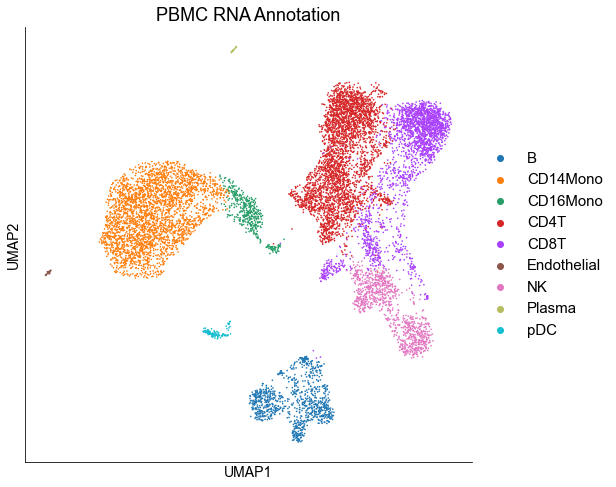
rna_adata.obs['louvain_cell_type'] = rna_adata.obs['louvain'].astype("str")

cluster2annotation = {
    '0': 'CD14Mono',
    '1': 'CD4T',
    '2': 'CD4T',
    '3': 'CD8T',
    '4': 'CD14Mono',
    '5': 'B',
    '6': 'CD4T',
    '7': 'CD4T',
    '8': 'CD16Mono',
    '9': 'CD14Mono',
    '10': 'B',
    '11': 'CD8T',
    '12': 'CD8T',
    '13': 'CD4T',
    '14': 'CD8T',
    '15': 'CD4T',
    '16': 'pDC',
    '17': 'Endothelial',
    '18': 'Plasma'
}

rna_adata.obs['louvain_cell_type'] = rna_adata.obs['louvain'].map(cluster2annotation).astype('category')

fig, ax = plt.subplots(1,1,figsize=(8,8))
sc.pl.umap(rna_adata, color=['louvain_cell_type'], title='RNA Annotation', legend_fontsize=15,ax=ax)
fig.show()
We used the matched barcodes to migrate the cell annotations to scATAC-seq data.
rna_adata.obs.index = [i.split('-')[0] for i in rna_adata.obs.index]

with open('example/PBMC/737K-arc-v1_ATAC.txt', 'r') as atac_bc_file:
    atac_bc = [i.rstrip('\n') for i in atac_bc_file.readlines()]
with open('example/PBMC/737K-arc-v1_RNA.txt', 'r') as rna_bc_file:
    rna_bc = [i.rstrip('\n') for i in rna_bc_file.readlines()]
keys = pd.DataFrame(np.zeros([len(rna_bc),2]), columns=['ATAC','RNA'])
keys['ATAC'] = atac_bc
keys['RNA'] = rna_bc
keys.index = keys['RNA']
atac_adata = sc.read_10x_h5('example/PBMC/data/PBMC_granulocyte_sorted_10k_peak_count.h5', gex_only=False)
atac_index = list(set(atac_adata.obs.index).intersection(set(keys.loc[rna_adata.obs.index,'ATAC'])))
atac_adata = atac_adata[atac_index,:]
write_to_mtx(atac_adata, 'example/PBMC/data/ATAC/filtered_mtx')
MAESTRO provides the utility that can convert mtx to h5 format.
MAESTRO mtx-to-h5 -d . --outprefix PBMC_granulocyte_sorted_10k_filtered_peak_count
We can run SCRIP with peak count matrix in either h5 or mtx format.
SCRIP enrich -i data/ATAC/filtered_mtx/PBMC_granulocyte_sorted_10k_filtered_peak_count.h5 -s hs -p multiome_pbmc_SCRIP -t 32
To check the biological finding of SCRIP results, we use the MAESTRO to perform the basic analysis for scATAC-seq data.
library(MAESTRO)
library(Seurat)
library(SummarizedExperiment)
library(dplyr)
library(motifmatchr)

pbmc_inputMat <- Read10X_h5('example/PBMC/data/ATAC/filtered_mtx/PBMC_granulocyte_sorted_10k_filtered_peak_count.h5')
pbmc.ATAC.res <- ATACRunSeurat(inputMat = pbmc_inputMat,
                                project = "atac",
                                min.c = 50,
                                min.p = 500,
                                method = "LSI",
                                dims.use = 1:30,
                                cluster.res = 0.6,
                                only.pos = TRUE,
                                peaks.test.use = "presto",
                                peaks.cutoff = 1e-05,
                                peaks.pct = 0.1,
                                peaks.logfc = 0.2,
                                outdir = "example/PBMC/analysis/")
pbmc.ATAC.singlecellexperiment <- as.SingleCellExperiment(pbmc.ATAC.res$ATAC)
saveRDS(pbmc.ATAC.singlecellexperiment,'example/PBMC/pbmc_ATAC_singlecellexperiment.rds')
atac_adata = read_SingleCellExperiment_rds('example/PBMC/pbmc_ATAC_singlecellexperiment.rds')
atac_adata.obs['Celltype'] = atac_adata.obs['seurat_clusters'].astype('str')
keys.index = keys['ATAC']
for i in atac_adata.obs.index:
    rna_bc = keys.loc[i,'RNA']
    atac_adata.obs.loc[i, 'Celltype'] = str(rna_adata.obs.loc[rna_bc,'louvain_cell_type'])
atac_adata.obs['Celltype'] = atac_adata.obs['Celltype'].astype("category")
fig, ax = plt.subplots(1,1,figsize=(8,8))
sc.pl.umap(atac_adata, color=['Celltype'], title='ATAC Annotation',ax=ax)
fig.show()

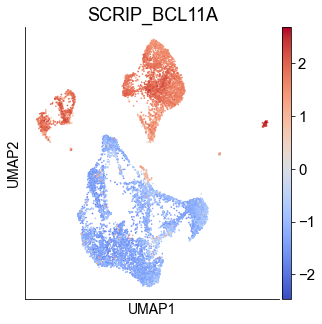
We checked the TR enrichment in cell types.
script_result_table = read_pickle('example/PBMC/multiome_pbmc_SCRIP_20211219/enrichment/tf_cell_score_df.pk')
atac_adata.obs['SCRIP_BCL11A'] = script_result_table.T.loc[atac_adata.obs_names,'BCL11A']
atac_adata.obs['SCRIP_BCL11B'] = script_result_table.T.loc[atac_adata.obs_names,'BCL11B']

fig, ax = plt.subplots(1,1,figsize=(5,5))
sc.pl.umap(atac_adata, color=['SCRIP_BCL11A'], cmap='coolwarm', ax=ax)
fig.show()
fig, ax = plt.subplots(1,1,figsize=(5,5))
sc.pl.umap(atac_adata, color=['SCRIP_BCL11B'], cmap='coolwarm', ax=ax)
fig.show()
